It’s been a week since the second meetup of R users community in Hanoi. I am privileged to be the first speaker presenting a technical topic to the group. Here is my humble writeup of the talk with my main takeaways (from the organizer/speaker’s perspective).
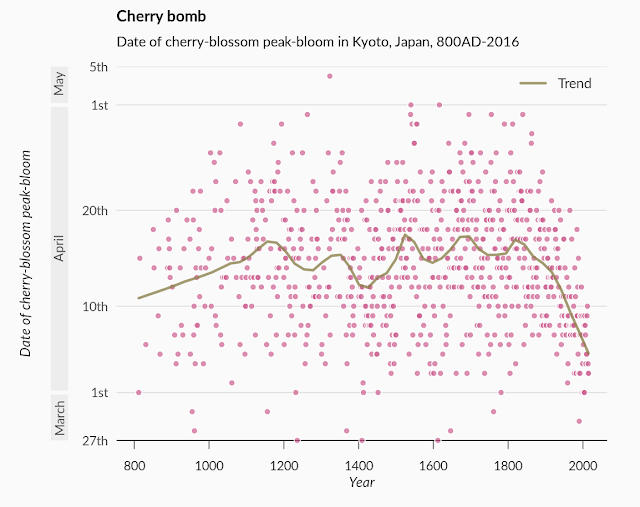
My presentation was about data visualization with R, to be more specific, on how to use base R graphics to make publication-ready graphs. I began the talk by showing some oft-seen examples of visualization from the web (e.g. national statistics office, news outlets) and print publications (i.e. research papers, reports), and claiming that those graphics could be done better (with R). Next, I moved quickly to the theoretical part of statistical graphics design, focusing on components of a visualization including visual encodings, coordinate system, scales and annotations. I tried to bring a structured approach to graph designing and during each section, I borrowed some not-so-good samples to illustrate my points.
I then went on to describe the R plotting systems, making the case for base graphics and provided code snippets on how to draw the most commonly used plots such as histogram, bar charts and line graphs. I also gave a greater details about customizing the default graphs with colors, annotations and spacing, etc. Finally, the audience was invited to practice visualization criticism regarding two qualities of effectiveness and beauty (You can find my slide at the end of this post).

Although I did not have enough time to run the demo, I was very excited that the talk received nice feedbacks from the audience. Personally, I think the meetup was a success for me as well as for the organizing team. It was welcomed by attendees comming from various professions and background. On another note, I also want to share some personal thoughts on what we can do to prepare better for the next event.
I must confess that the meetup did not got much attention from the community (as I expected). It was not an well attended event, with about 15 people in attendance out of 20 people signed-up. A possible way to increase participation is to share the meetup event outside the facebook group (TKUD) so that we can reach out to other groups and users with same interests.
There is arguably a gap in level of R experience among participants. Besides, they are also using R in different applications, namely finance, bioinfomatics, teaching, etc. Future speakers should bear these in mind not only in constructing the content, but also in making adjustments to the entire design of the presentation. I suggest that a small survey of audience background before the meetup will help in this case.
I really look forward to the next meetup.